What is the Unemployment Rate
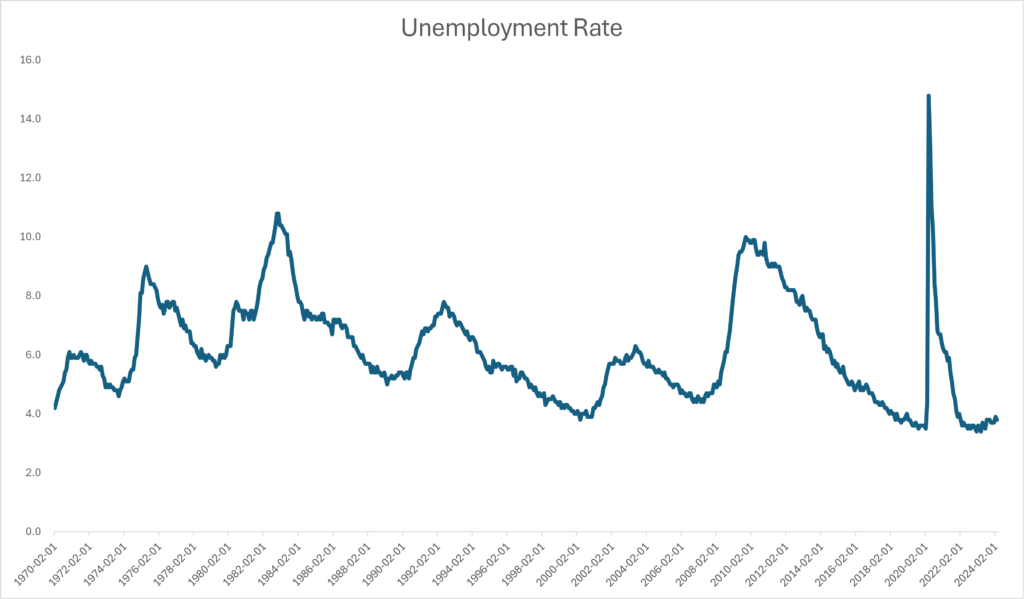
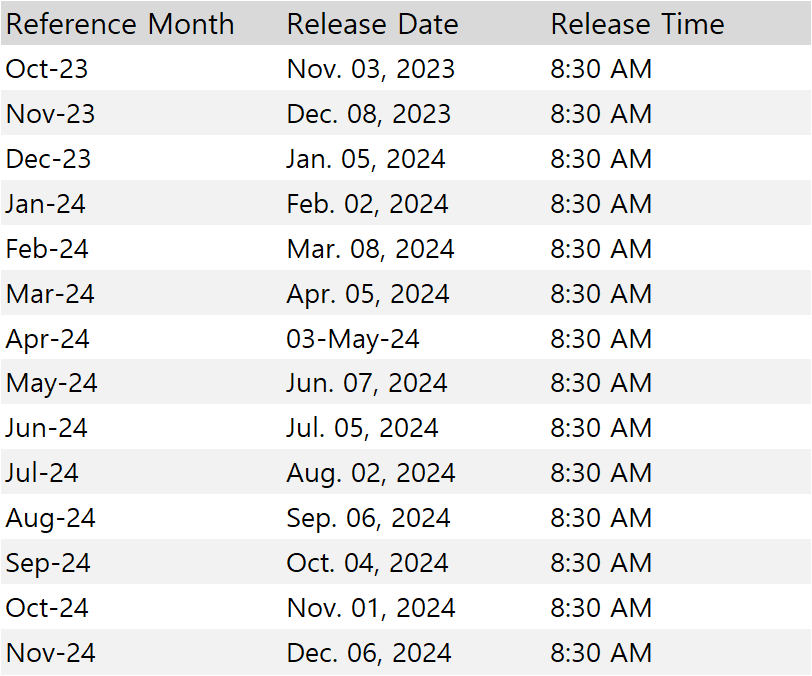
The unemployment rate is categorized into different types based on the U.S. Bureau of Labor Statistics (BLS) standards, each given a U-series number. The standard measure is U-3, for it is widely accepted and consistent for measuring the level of unemployment within an economy. It shows how many people don’t have jobs and are looking for work . A low rate means more people have jobs, while a high rate means more people are struggling to find work. Unemployment rates are typically reported monthly by the Bureau of Labor Statistics in the United States.

Click to see key types of unemployment rate. This classifications help provide a detailed understanding of the labor market conditions:
U-1
- The U-1 rate measures the percentage of the labor force unemployed for 15 weeks or longer. It shows how many people keep trying to find a job without success for over three months. This helps understand how many are really struggling to get hired.
U-2
- The U-2 rate captures the percentage of the labor force who lost jobs or completed temporary work. It provides picture of the immediate impacts of changes in the economy on employment. For example, if there’s a sudden economic downturn or if a large company lays off many workers, the U-2 rate helps us see this effect quickly.
U-3
- The U-3 rate is the official unemployment rate, which measures the percentage of the total labor force that is unemployed and has actively looked for work within the past four weeks. This is the most commonly reported and cited measure of unemployment. It does not include those who are retired, attending school full-time, or not actively looking for work.
U-4
- This rate adds discouraged workers to the U-3 rate. Discouraged workers are those who are not currently looking for work because they believe no jobs are available for them.
U-5
- The U-5 rate includes discouraged workers plus all other “marginally attached workers.” Marginally attached workers are those who are not looking for work for reasons such as school attendance or family responsibilities but are still available to work and have looked for a job within the past 12 months.
U-6
- The U-6 rate includes those counted in U-5 plus part-time workers who want and are available for full-time work but have had to settle for a part-time schedule. This is sometimes referred to as the underemployment rate because it includes those who are working less than their desired capacity.
Unemployment Rate for Stock Price Relation
The U-3 rate serves as an indicator of labor market health. When unemployment is low, more people have jobs and disposable income, potentially leading to increased consumer spending. This boost in spending can benefit companies by driving up their revenues and profits. Therefore, as unemployment decreases, expectations that companies will perform better due to lower unemployment rates may encourage investors to buy more stocks, eventually pushing stock prices upward.
However, a decrease in unemployment can also push stock prices downward. When many people have jobs, they tend to spend more money, which can drive prices up. To prevent prices from rising too quickly, the Federal Reserve might make borrowing money more expensive by increasing interest rates. When borrowing costs rise, people and businesses typically spend and invest less, which helps maintain price stability. So, when unemployment is low, the Fed may raise interest rates to prevent prices from increasing too rapidly and to keep the economy balanced. This can cause stock prices to decrease when the unemployment rate decreases because the increase in interest rates usually leads to a decrease in stock prices.
Conclusion
If investors believe that low unemployment will continue to drive economic growth and company profits, they might continue to buy stocks despite potential interest rate rises. But if they worry that economic growth might not last or if the effects of interest rate rises will be significant, they might sell stocks, pushing prices down. So, whether unemployment going down is good or bad for stocks depends on what investors believe about the economy and interest rates.
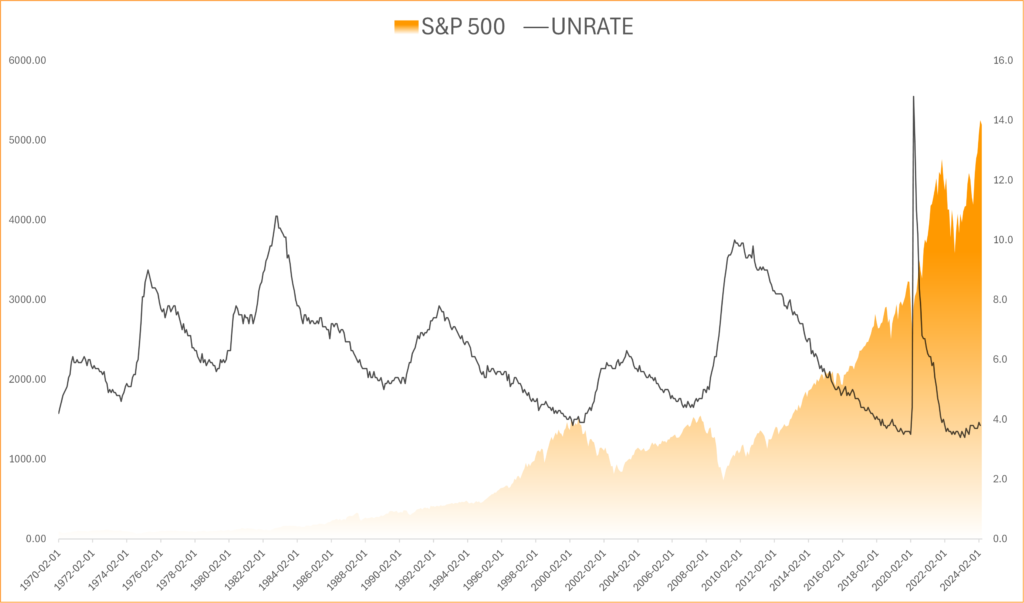
Chart View: S&P 500 and Unemployment Rate(U3)

The graph seems to show that when the U3 rate decreases, overall stock prices increase, and vice versa. The correlation coefficient of -0.41 implies that they are in an inverse relationship, which is moderate but not strong. Therefore, it is dangerous to solely base investment decisions or analyses on unemployment, as this correlation only demonstrates a tendency. Comprehensive analyses that consider multiple factors before making investment decisions are needed.